December 19, 2025
Financial markets have a short attention span. With 2025 coming to a close, it proved to be a good year for many asset classes: equities posted double-digit gains across most markets, fixed income benefited from solid carry and declining spreads, and real assets such as infrastructure and gold were good diversifiers in multi asset portfolios.
Asset class performance 2025 year-to-date

Sources: Bloomberg, Nomura; Data from 31 December 2024 to 30 November 2025. Performance in USD; except * USD hedged. Please see Appendix for Index definitions. Indices are unmanaged and one cannot invest directly in an index. Charts for illustrative purposes only. Past performance is not indicative of future results.
However, these returns mask the volatile macro backdrop of 2025: trade wars, geopolitical uncertainty, central bank policy shifts, and the ongoing theme of artificial intelligence (AI) seem to have been shrugged off by markets several times. Just like the quip of what makes a good rock song (everything has to be louder than everything else), one theme followed another, ultimately driving markets from one all-time-high to the next, posing the question “what will matter in 2026?”
In this outlook, we will explore the key themes for the coming year. We look at economic activity and each of its drivers, importantly the state of the consumer, the trajectory of fiscal policy, and the potential for corporate investment (CapEx) to return to the stage after years of absence. With global central banks engaging in considerable easing in 2025, the outlook for monetary policy remains a key consideration, too.
We also try to identify key risks to our base case, including concerns around debt sustainability, a potentially vanishing AI enthusiasm, and systemic risks in the private credit market. But perhaps most importantly, we synthesize what it could all mean for various asset classes, to identify what we believe are the key opportunities for investors in the coming months.
Monetary and fiscal policy – the band is in sync
As inflation rates subsided from their very high levels, many central banks around the world have started to ease policy. After being on hold for most of the year, the US Federal Reserve (Fed) also joined the chorus in September 2025 initially. Referring to a weakening labor market, facing political pressure through the US administration, and with the outlook for a new Fed chair, the expectations for the Fed are to keep an easing bias in 2026.
Global central bank tracker – rate hike/cut diffusion index

Sources: Macrobond, Nomura. Data from 01 January 2010 to 12 December 2025
The more opaque part of central bank policy, and thus the one we believe could be more market moving, is its balance sheet. The Fed has already announced to stop reducing its balance sheet (quantitative tightening, QT) by December 2025. However, as confirmed in the Fed’s December meeting, it seems that 2026 may see a revival of balance sheet expansion, akin to quantitative easing (QE), historically associated with rising 10-year yields, but broadly a supportive environment for risky assets such as high yield bonds and equity markets.
Why? Apart from the potential for a committee-based dovish tilt under a new Chair, the Fed is currently operating under an “ample reserves” regime. One side effect of this could be a relatively stable balance sheet in % of GDP , which in turn leads to a growing dollar-value in Treasury securities held, as nominal GDP increases. Per the Fed’s own projections, this could mean purchasing $300-600bn annually in the coming years, and up to $900bn if nominal GDP would be closer to 6% p.a. Alternatively, the Fed is considering beneficial regulatory changes to the treatment of Treasury securities in the calculation of capital requirements for banks, which could increase demand from financial institutions, providing effects similar to QE.
Projected holdings on the Fed’s balance sheet

Projected holdings as % of
GDP

Source: NY Fed, Nomura. Data from 2010 to 2024, forecast through 2034 by the NY Fed.
The bottom line is that we believe monetary policy could remain accommodative or at least less restrictive in the months ahead. And this may happen while government spending is also elevated. The US budget deficit could remain in its current 6-8% of GDP range, a considerably higher level than before the global COVID-19 pandemic. Apart from ongoing direct outlays, newly created deductions for research & development spending, tax cuts, and other incentives that will come into effect in 2026 could also have a meaningful stimulative effect on US economic activity.
While it might make John Maynard Keynes turn in his grave, the simultaneous easing of monetary and fiscal policy creates conditions ripe for a reacceleration – and potentially even an overheating – of the US economy. Developments that could be further amplified as policy uncertainty, particularly around trade and tariffs, subsides. In turn, nominal GDP growth that could result from these measures might mean government debt levels could remain contained despite elevated fiscal spending, as long as economic activity remains quite strong – a repeat of what we witnessed in 2023-24, when the US debt-to-GDP level grew only by 1.3 percentage points, despite a much higher deficit.
Policy outside the US – a World Tour
The European Central Bank seems to have a similar bias as the Fed, albeit to a lesser extent. That could also be the case for the Bank of England, and most other regional European central banks. Easier monetary policy, and a potential resumption of QE on a broad basis could create a supportive backdrop for financial markets, and risk assets in particular. Central banks continue to act quite synchronized, not going against the tide that comes rolling from the US. The odd one out is the Bank of Japan, where local inflation continues to creep up – a unique situation, not least compared to its own history.
Fiscal policy also continues to be highly accommodative across most countries, even if not many are keeping up with the deficit levels of the US. We find Europe the most interesting space to watch, particularly Germany, as the decade-long focus on budget consolidation increasingly seems to have been abandoned. Still, fiscal spending is less decisive compared to the US, which could mean that economic growth might not accelerate as rapidly.
FY2025 Consensus GDP Forecast

FY2026 Consensus GDP Forecast

Source: Bloomberg, Nomura. Data from 01 January 2025 to 09 December 2025.
For Germany specifically, we think it is questionable if the fiscal impulse will be as transformative as some market commentators have predicted at the beginning of 2025. Burdening bureaucracy, a stretched labor market, political hiccups in the three-party coalition, and the historic dependency on exports to China cloud the outlook. However, the change in mindset regarding the use of government expenditure, and its impact on sentiment, both for foreign investors and the private sector, should not be underestimated. It could lift asset prices, despite the impulse on real GDP remaining rather subdued.
Consumers – the main audience
In the US, a solid employment situation, rising capital markets, and government stimulus have encouraged households to keep spending, despite a volatile macro backdrop. Consumption continues to be the most important contributor to US GDP, hence it is critical how consumer sentiment evolves.
We think the labor market is still in very good shape, supporting household income. While nonfarm payrolls and the unemployment rate have retreated from their elevated levels of 2022-23, we view the current environment as a normalization, not a pronounced weakening. Understanding the policy-induced decline in the foreign-born labor force compared to native-born workers clarifies that picture. As fewer foreign-born workers enter the labor market, and many leave altogether, we believe a “new normal” for a solid nonfarm payroll print could be closer to 30-80,000 added jobs per month to keep unemployment and inflation broadly stable, compared to the 200,000 of previous years.
In addition, household leverage is at multi-decade lows, as home prices and financial markets have recorded steady gains. This creates a considerable buffer for consumers to re-lever even if the labor market deteriorates modestly. Importantly, the accumulated wealth in the middle- and upper-class cohorts of households could sustain consumption in the months ahead, as they are a key driver for overall economic activity.
Middle 40% of consumers show considerable spending

Source: Bloomberg, Nomura. Data from 01 January 2025 to 09 December 2025. * Home furnishings, entertainment, restaurants, travel, alcohol, new cars
Legislation should benefit higher-income households

Sources: Nomura, CBO, Yale Budget Lab, Treasury Department, Tax Policy Center, Joint Committee on Taxation, Piper Sandler.
What could derail this constructive consumer outlook? A meaningful decline in real household income is an important risk to monitor. We believe this could come from two main sources: a reacceleration of inflation, or a substantial weakening of the labor market. The latter does not seem very likely, in our view, amid the structural changes in the labor force. Inflation, however, continues to be a key risk, as it could stem from many idiosyncratic sources, including housing, wage growth, tariffs, or an increase in commodity prices.
The outlook for consumption in the rest of the world is not materially different, but more clouded amid generally higher savings rates, and more cautious consumer sentiment. Examples include China, where the burst of the housing market bubble has led to depressed spending. European households still gnaw on the entrenched stagflationary environment, with a change from the broader fiscal stance not yet leading to a brighter mood among consumers, but this could pose some upside risk in the months ahead when government spending is perceived as being more permanent and effective.
CapEx – the guitarist returns to stage after rehab
There are plenty of examples in the Rock & Roll Hall of Fame where the lead guitarist returned from rehab and just smashes an iconic solo. This is very much the story of renewed capital expenditures (CapEx). Corporate investment has been practically absent since the 2008 Great Financial Crisis, but recent data-center and AI-related spending have been a major contributor to economic activity. As we expect government spending and consumption to remain relatively steady, continued strong corporate spending could make a difference for GDP growth in the months ahead.
For now, CapEx has been predominantly driven by the so-called “hyperscalers” – AI companies that have generated extraordinary levels of free cash flow since the global pandemic and now invest hundreds of billions of dollars to remain competitive in the AI race (Alphabet, Amazon, Meta, Microsoft, and Oracle). Increasingly, there are circular investments between those companies, leading investors to question the sustainability of the AI-fueled equity market rally, and putting pressure on companies with weaker balance sheets relative to peers (such as Oracle, as visible in their CDS spread).
US hyperscaler capital expenditure & free cashflow

Sources: Bloomberg, Nomura. Data from FY2010 to FY2030e (Bloomberg consensus estimates) for Alphabet, Amazon, Meta, Microsoft, and Oracle.
Undoubtedly, Large Language Models (LLMs) already create productivity gains in many industries. However, like in previous episodes of significant investments in new industries (e.g. the optical fiber build in the US in the 1990s), the more considerable impact on corporate bottom lines might only happen with a delay, as adoption of new technologies in the wider economy takes time.
A broadening of the AI theme in a “second wave” could mean that instead of a handful of companies posting significant double-digit earnings growth, many more companies could see improvements in earnings, while these “hyperscalers” revert to longer-term average growth rates. Despite the current index concentration, 50+ companies improving their earnings growth by a few percentage points could lead to additional upside for equity markets, even if earnings of the few “hyperscalers” normalize from 50+% growth rates.
Hyperscaler earnings growth normalized, but still solid

Source: Nomura, Bloomberg. Data from 31 March 2022 to 10 Dec 2025.
With AI being the elephant in the room it is important to consider a few key risks for the theme:
- Technology: as the DeepSeek case earlier in 2025 showed, the advent of a new technology that would use much less energy or would otherwise be superior to current models could disrupt the entire AI investment landscape.
- Regulation: the oligopolistic (in some cases close to monopolistic) nature of many global technology companies has posed the risk of regulatory scrutiny for many years. Regulation of AI specifically would add to that risk. That said, the current policy stance in the US seems more biased towards deregulation, whereas the European Union continues to put pressure on the large technology firms.
- Valuations: many equity markets have traded well above their long-term average Price-to-Earnings multiples in 2025, but AI company valuations are particularly elevated. A re-rating poses considerable downside potential.
Key risks – what if the band breaks up?
As for our constructive outlook for global economic activity – what are the key risks to this base case?
- With consumption as the largest driver for growth, anything that could derail household spending continues to be a risk. A self-reinforcing weakening in the labor market (as opposed to the ongoing normalization outlined above), or a return of inflation which could depress real wages poses the risk of a stagflationary environment or a negative growth shock.
- Fiscal policy is another source of concern: while the theme of debt sustainability is top of mind for many investors, it hasn’t turned into a broad-based sell-off in government bond markets. While we don’t believe the status of the US dollar as the world’s reserve currency will be questioned, the UK case of 2024 around its fiscal woes shows that heightened volatility at the longer end of yield curves can happen suddenly. The US mid-term elections, another potential government shutdown, or underwhelming nominal growth are risks to the fiscal policy outlook.
- Relatedly, (geo)politics remain a risk. While recent months have seen some stabilization of international trade relations, populism and protectionism remain present and have the potential to flare up again. The ongoing decoupling from China presents challenges for many industries, particularly in Europe.
- Finally, a significant correction in financial markets could depress real economic activity. Many asset classes are trading at expensive valuations as measured, e.g., by metrics such as the Cyclically Adjusted Price-to-Earnings ratio (CAPE) for equities or spread levels for corporate bonds across investment grade and high yield. A potential bubble in AI-related stocks adds to that risk. If corporate earnings falter, it could pose risk of a re-rating in global financial markets.
All of these scenarios are potential downside risks to the economic outlook. While not our base case, we look at ways to diversify portfolios to navigate different outcomes in the next section.
Asset class implications
In recent years, we have observed episodes in markets where asset class performance was seemingly disconnected from the macroeconomic backdrop. Consequently, while our economic outlook remains constructive, we continue to believe it is essential to look at the factors ultimately and directly driving various asset classes.
US Output Gap vs. deviation of equity/fixed income total return from its long-term trend

Source: Bloomberg, LSEG, Nomura. Data from December 1987 to 8 Dec 2025, CBO projection until Dec 2030.
The chart shows one example of a dispersion between macro and markets. If the economy grows at potential (i.e. the Output Gap is zero), investors should earn the equity risk premium, and the relative stock-bond performance should be close to its long-term upward trend. If the economy accelerates and grows faster than trend, this should be supportive for equity markets, and possibly detrimental for fixed income, as sustained growth above potential can be one source of inflation.
This relationship broadly held until 2022, but the rise of inflation and the launch of ChatGPT have led to a considerable disconnect. Markets seem to discount a much bigger AI-related impact on productivity; hence the relative stock-bond performance has been deviating from its long-term trend. This is another reason why we believe it is important to focus on drivers for asset classes almost independent of the general macroeconomic environment.
Cross-asset: equities vs. fixed income
In the important question of cross-asset allocation, our models provide mixed signals currently. The equity risk premium – based on discounted future dividends – sits in the middle of its historic range, suggesting a balanced allocation between stocks and bonds. And while equity market valuations are elevated in many areas, longer-term historic returns are not unusually high – remaining within one standard deviation compared to their own history. Our economic outlook should be broadly supportive for stocks, and the bull market that began in late 2022 is neither particularly stretched in duration nor cumulative return.
Equity risk premium model: at the long-term average

Sources: Macrobond, I/B/E/S, Nomura. Data from Jan 1988 to Oct 2025.
Sector weight comparison: US stocks vs bonds

Sources: Blomberg, Nomura. Data as of 25 November 2025.
A diversified allocation across equities and fixed income has served investors well, including in 2025, as both assets performed strongly over the last three years. However, our base case of strong US nominal growth carries the risk of an inflationary surprise, particularly if fiscal impulses re-accelerate. The risk of temporary upside inflation shocks could change the stock-bond correlation. What might still help somewhat in such an environment is a very different sector mix between major stock and corporate bond indices.
Equities
Corporate earnings have remained strong in 2025. Lower financing costs, tax cuts, deregulation and productivity gains could continue to help sustain profit margins, even if they are elevated by historic standards. This is particularly true for US large cap companies – providing some justification for their more stretched valuations compared to other markets. But it’s those valuations that could lead to a re-rating and thus an equity market pullback anytime.
Current valuation percentiles across regions1
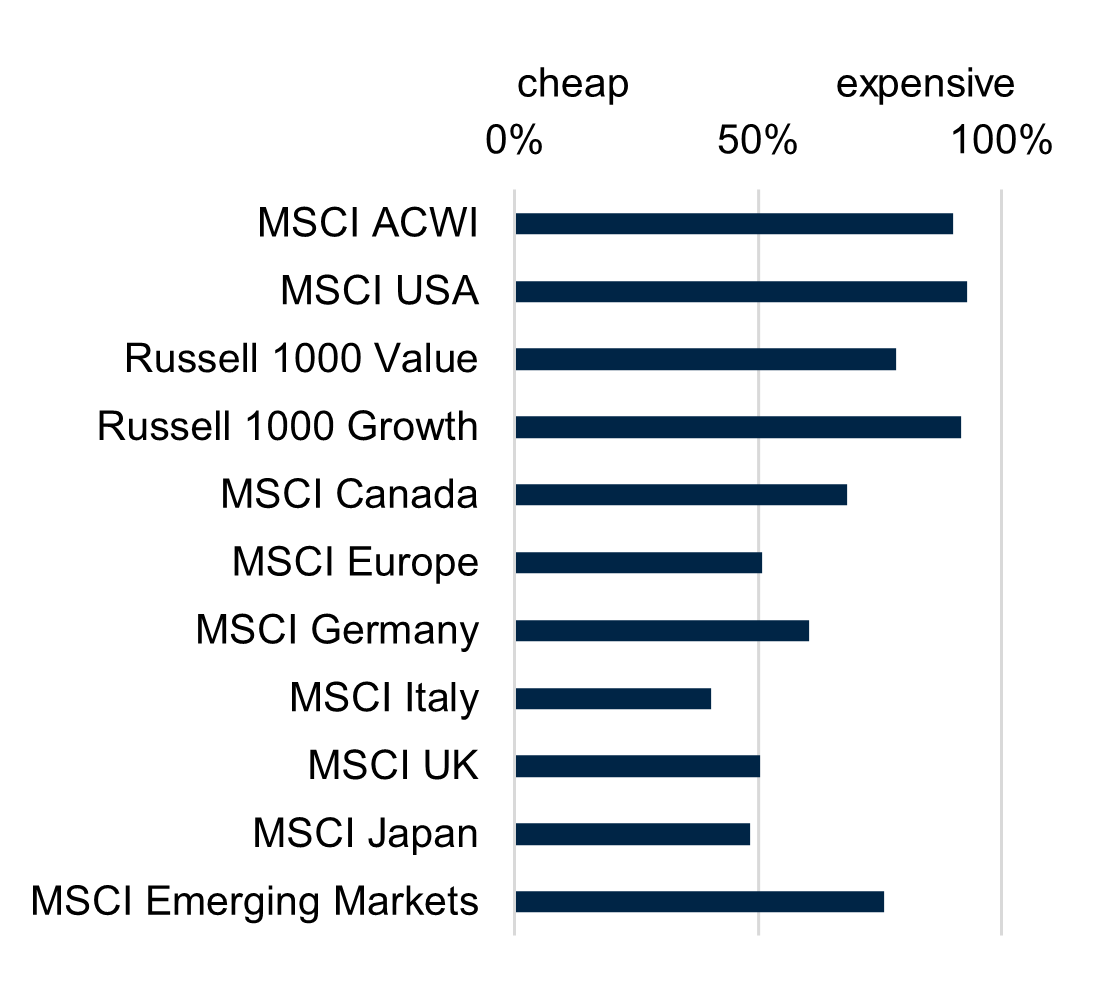
Source: LSEG, Bloomberg, Nomura. Data from Dec 2005 to Nov 2025
Drawdown analysis for the US equity market

Source: Macrobond, Nomura. Data from Jan 1871 to Nov 2025
While the monthly returns in the above analysis are masking some of the intra-month volatility, we’ve found base rates helpful to set expectations around a potential correction: looking at monthly historic data since 1871 there were 182 occurrences of pullbacks or corrections from previous all-time highs. 39 of those have been between -5% and -10%, 15 between -10% and -20%, and a total of 16 have been in “bear market” territory, often defined as drawdowns of -20% or more.
April 2025 saw the last meaningful pullback. Ever since, investors have rightly favored growth companies and profitable cyclicals with pricing power, strong balance sheets, and exposure to increasing capex. Amid rising index concentration, diversification within equities has been perceived as costly. However, we continue to believe that while maintaining core US exposure, spreading allocations into other markets is a prudent strategy, and could be beneficial in 2026 if the cycle broadens. Here are some areas that we find interesting:
- AI-adjacent sectors such as power infrastructure and software enablement. These have lagged the “hyperscalers” but could benefit as AI adoption increases.
- European markets, as a renewed focus on fiscal spending could lead to similar (albeit likely lower) support for profit margins like we have observed in the US, and valuations are more compelling.
- Asia ex China, as the overhaul of global supply chains could lead to neighboring countries picking up areas that are less feasible for potential re-shoring. .
Recent export data suggests some relocation of supply chains within Emerging Markets

Sources: Bloomberg, Nomura. Data from December 2021 to November 2025.
Fixed income
With US 10-year yields being in decline for most of 2025, we view the risks more to the upside for next year, as the potential return of inflationary pressure amid solid economic activity – and thus higher nominal GDP growth – could see yields rise. In our base case scenario we do not expect debt sustainability concerns to suddenly become the main driver of US rates. At the same time the balance sheet reduction of the Fed in the last years has likely increased the share of yield-sensitive investors in the Treasury market. However, inflation might also influence the stance of the Fed, maybe engaging in fewer rate cuts than currently priced in rates markets. In addition, potential balance sheet expansion as discussed above could work its way through to higher rates, as was the case in historic episodes of QE.
Historically, US 10y yields have increased during periods of Quantitative Easing

Source: Macrobond, Nomura. Data from 01 January 2007 to 30 November 2018
Lastly, the large budget deficit needs funding, and while a lot of Treasury issuance happened at the shorter end of the yield curve, increased bond supply could still impact the longer end as well. Still, core duration exposure could be beneficial in a more downside economic scenario of growth deceleration. Rates are considerably higher than five years ago, possibly adding more diversification potential in such a case. And one big change in the bond market landscape is the return of a positively sloped yield curve, providing much better carry and rolldown compared to recent years.
Looking from rates markets to other parts of fixed income, the picture is quite homogenous and not very enticing: Investment grade credit, high yield, and emerging markets debt all trade at extremely tight spread levels, in many cases close to their post-2008 lows. While the economic backdrop should be broadly supportive for risk premia, this environment lends itself towards a more selective approach in these asset classes, as we don’t think there is much room for tighter spreads, and the low extra carry doesn’t offer much protection against event risk. In our view, the most optimistic outcome would be steady rates and spreads.
Spreads are close to their lows across major fixed income sub-asset classes

Sources: Bloomberg, J.P. Morgan, ICE BofA, Nomura. Data from 31 December 2007 to 28 November 2025.
Alternative assets
Inflation, high index concentration and elevated stock market valuations remain three key considerations when constructing portfolios for 2026. Therefore, many listed real assets such as infrastructure could play an important role for investors. Listed infrastructure and regulated utilities could benefit from capex-linked demand (grid, data centers, transmission) and can provide inflation pass-through. Defensive real estate subsectors tied to digital and logistics infrastructure can diversify equity beta, while avoiding areas exposed to refinancing stress. Inflation aside, gold and other commodities could remain a useful hedge against policy, politics and geopolitical volatility, but these assets can have short-term supply-and-demand cycles, justifying a more tactical approach.
Average return when inflation is
rising

Average return when there is unexpected inflation2

Sources: Nomura, LSEG, Bloomberg. All data is based on historical monthly index data from January 1973 to December 2024. Please see Appendix for Index definitions.
Private credit could continue to face some headwind amid idiosyncratic risks and potential regulatory change for the banking sector in the US. However, amid historically low spreads in the traditional fixed income markets, selective allocations could still be justified for investors seeking higher nominal yields, particularly in areas that can’t be easily accessed in liquid markets, or where an arbitrage exists, e.g. when banks are not willing to provide financing.
A similar picture emerges for Private Equity: while the smoothing of returns might be perceived as an attractive feature in itself, accessing unique opportunities that are not available in public markets (e.g. disruptors in the AI space) might create value for investors in coming years.
Summary and asset allocation snapshot
The macro score for 2026 is set at a tempo that should suit risk assets: nominal growth strong enough to support earnings, broadly accommodative fiscal and monetary policy, and a corporate investment cycle that could finally broaden beyond a handful of champions. Yet richer valuations and the inflation channel argue for humility. We can’t predict the cacophony of events that will take center stage next year, one louder than the other, but we can prepare – hence resorting to the traditional qualities of diversification and active, tactical shifts will be important.
In this environment, multi asset investing is less about finding a single melody and more about arranging for resilience. A robust, risk-based framework tilted to equities over bonds, layered with genuine diversifiers, and managed with discipline should give investors the best chance to keep compounding when the next refrain hits. The band is still in sync; the audience should enjoy the performance but keep an eye on the exits and a hand on the volume knob.

The opinions expressed are those of the author(s), are as of the date indicated, and may change based on market and other conditions.
For institutional investors and investment professionals only.
As of December 1, 2025, Nomura Holding America Inc. completed the acquisition of Macquarie Asset Management's US and European public investments business.
This information is a general description of Nomura Asset Management only. The views expressed on this website represent those of the relevant investment team and are subject to change. No information set out above constitutes advice, an advertisement, an invitation, a confirmation, an offer or a solicitation, to buy or sell any security or other financial product or to engage in any investment activity, or an offer of any banking or financial service. Some products and/or services mentioned on this website may not be suitable for you and may not be available in all jurisdictions.
Investing involves risk including the possible loss of principal. The investment capabilities described in this website involve risks due, among other things, to the nature of the underlying investments. All examples herein are for illustrative purposes only and there can be no assurance that any particular investment objective will be realized or any investment strategy seeking to achieve such objective will be successful. Past performance is not a reliable indication of future performance.
Before acting on any information, you should consider the appropriateness of it having regard to your particular objectives, financial situation and needs and seek advice.
Nomura Asset Management, unless otherwise stated, refers to the Nomura Asset Management International business. Nomura Asset Management is part of the Investment Management Division of the Nomura Group, providing integrated public and private market asset management services across equities, fixed income, private credit and multi-asset solutions to intermediary and institutional clients. Nomura Asset Management primarily operates through several distinct investment managers, which includes Nomura Investment Management Business Trust (NIMBT), a Securities and Exchange Commission (SEC) registered investment adviser. Investment advisory services are provided to the Nomura Funds by Delaware Management Company, a series of NIMBT. The Nomura Funds are distributed by Delaware Distributors, L.P., a registered broker/dealer and member of the Financial Industry Regulatory Authority (FINRA) and an affiliate of NIMBT.
Nomura Asset Management is part of the Investment Management Division of the Nomura Group, providing integrated public and private market asset management services across equities, fixed income, private credit and multi-asset solutions to intermediary and institutional clients. Nomura Asset Management primarily operates through several distinct investment managers, which include Nomura Capital Management LLC, Nomura Corporate Research and Asset Management Inc., Nomura Investment Management Business Trust (consisting of the Nomura Alternative Strategies, Nomura Investment Management Advisers, Nomura Investments Fund Advisers, Delaware Capital Management, and Delaware Management Company series), Nomura Investment Management Europe S.A., and Nomura Investment Management Austria Kapitalanlage AG. Under certain circumstances, investment advisory services are also provided by Nomura Asset Management Australia Pty Limited, which is a Nomura Group company.
This market commentary has been prepared for general informational purposes by the author, who is part of Nomura Asset Management International and is not a product of the Nomura Research Department. Nothing in this market commentary shall be construed as a solicitation to buy or sell any security or other product, or to engage in or refrain from engaging in any transaction. Nomura conducts a global full-service, integrated investment banking, asset management, and brokerage business. Nomura may do, and seek to do, business with any of the companies covered in this market commentary. Nomura has investment banking and other business relationships with a significant number of companies, which may include companies that are discussed in this commentary, and may have positions in financial instruments or other financial interests in the subject matter of this market commentary. As a result, investors should be aware that Nomura may have a conflict of interest that could affect the objectivity of this market commentary. In preparing this market commentary, we did not take into account the investment objectives, financial situation, or needs of any particular client. You should not make an investment decision on the basis of this market commentary. Before making an investment decision you need to consider, with or without the assistance of an adviser, whether the investment is appropriate in light of your particular investment needs, objectives, and financial circumstances. Nomura salespeople, traders and other professionals may provide oral or written market commentary, analysis, trading strategies or research products to Nomura’s clients that reflect opinions which are different from or contrary to the opinions expressed in this market commentary. Nomura’s asset management business, principal trading desks and investing businesses may make investment decisions that are inconsistent with the views expressed in this commentary. There are risks involved in investing. The price of securities and other financial products can and does fluctuate, and an individual security or financial product may even become valueless. International investors are reminded of the additional risks inherent in international investments, such as currency fluctuations and international or local financial, market, economic, tax, or regulatory conditions, which may adversely affect the value of the investment. This market commentary is based on information obtained from sources believed to be reliable, but we do not make any representation or warranty that it is accurate, complete, or up to date. We accept no obligation to correct or update the information or opinions in this market commentary. Opinions, information, and data in this market commentary are as of the date indicated on the cover and subject to change without notice. No member of the Nomura Group accepts any liability whatsoever for any direct, indirect, consequential, or other loss arising from any use of this market commentary and/or further communication in relation to this market commentary. Some of the data in this market commentary may be sourced from information and materials published by government or industry bodies or agencies, however this market commentary is neither endorsed or certified by any such bodies or agencies. This market commentary does not constitute legal, tax accounting, or investment advice. Recipients should independently evaluate any specific investment in consultation with their legal, tax, accounting, and investment advisors. Past performance is not indicative of future results. All third-party marks cited are the property of their respective owners.
Indices are unmanaged and one cannot invest directly in an index. Past performance is not indicative of future results
© 2026 Nomura Asset Management International Inc.
[5199057 – 02/2026] | INSIGHT-MAQ-1Q26